
Call Center KPI Benchmarks By Industry (2026)
- Published:
- Updated:
- Authored by
-
 Richard James Director of Organic Growth and CX
 - Reviewed by
-
 Sean Minter Founder, CEO
AmplifAI’s call center KPI benchmarks by industry compares 2026 median data across customer experience, resolution, handle time, service cost, self-service, occupancy, attrition, and frontline satisfaction, using CMP research median benchmarks.
Healthcare, financial services, insurance, retail, technology, government and nonprofit, travel, utilities, education, B2B and professional services, and automotive contact centers each carry different service models, customer journeys, issue complexity, workforce pressure, and self-service patterns. Use industry median averages as the starting point, read call center KPI benchmarks as connected performance measures, because one KPI rarely explains contact center performance without the related KPIs measured alongside it.
Compare your call center’s KPI benchmarks against the industry medians below to see where your performance sits, where gaps exist, and which of your metrics need a closer look.
Working out your call center KPIs yourself? Our call center productivity guide shows how to calculate FCR, average handle time, CSAT, cost per contact, occupancy, and attrition.
Call Center KPI Benchmarks by Industry
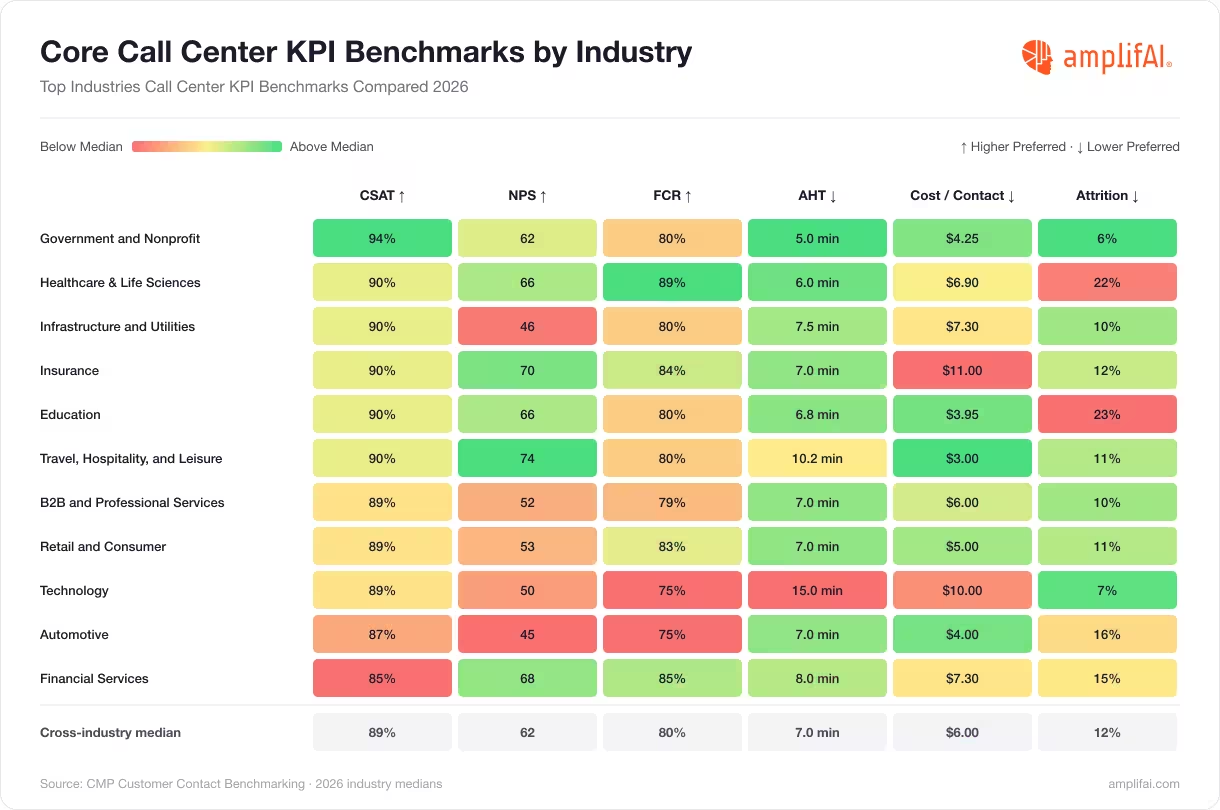
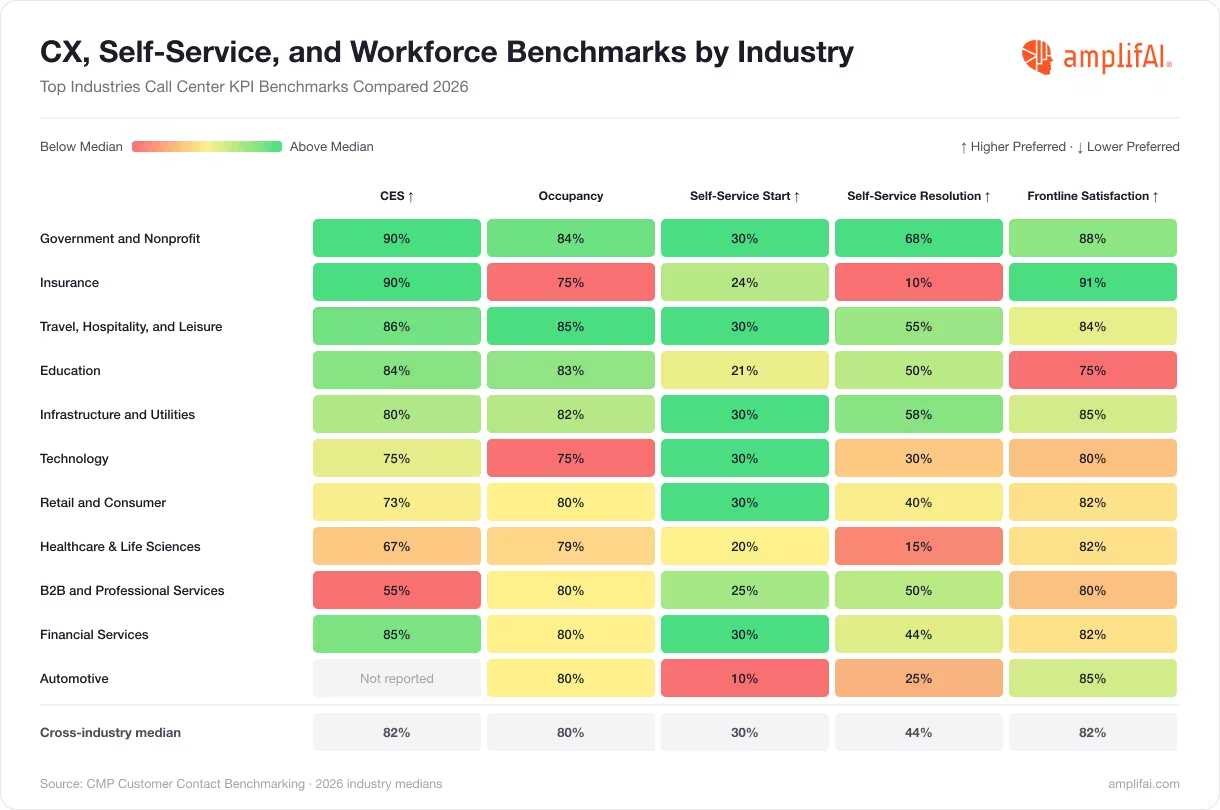
Compare call center KPI benchmarks across industries using 2026 CMP median data. Use the core call center KPI benchmarks table to benchmark CSAT, NPS, first contact resolution, average handle time, cost per contact, and attrition, and use the call center CX, self-service, and workforce benchmarks table to benchmark customer effort, occupancy, self-service start rate, self-service resolution, and frontline satisfaction.
Core Call Center KPI Benchmarks
| Industry | CSAT | NPS | FCR | AHT | Cost / Contact | Attrition |
|---|---|---|---|---|---|---|
| Government and Nonprofit | 94% | 62 | 80% | 5.0 min | $4.25 | 6% |
| Healthcare and Life Sciences | 90% | 66 | 89% | 6.0 min | $6.90 | 22% |
| Infrastructure and Utilities | 90% | 46 | 80% | 7.5 min | $7.30 | 10% |
| Insurance | 90% | 70 | 84% | 7.0 min | $11.00 | 12% |
| Education | 90% | 66 | 80% | 6.8 min | $3.95 | 23% |
| Travel, Hospitality, and Leisure | 90% | 74 | 80% | 10.2 min | $3.00 | 11% |
| B2B and Professional Services | 89% | 52 | 79% | 7.0 min | $6.00 | 10% |
| Retail and Consumer | 89% | 53 | 83% | 7.0 min | $5.00 | 11% |
| Technology | 89% | 50 | 75% | 15.0 min | $10.00 | 7% |
| Automotive | 87% | 45 | 75% | 7.0 min | $4.00 | 16% |
| Financial Services | 85% | 68 | 85% | 8.0 min | $7.30 | 15% |
| Cross-industry median | ~89% | ~62 | ~80% | ~7 min | ~$6 | ~12% |
| Cite benchmarksSource: CMP Customer Contact Benchmarking dataset. Figures are 2026 industry medians. | ||||||
| CSAT = Customer Satisfaction | NPS = Net Promoter Score | FCR = First Contact Resolution | AHT = Average Handle Time | Attrition = Annual Frontline Attrition | ||||||
Call Center CX, Self-Service, and Workforce Benchmarks
| Industry | CES | Occupancy | Self-Service Start | Self-Service Resolution | Frontline Satisfaction |
|---|---|---|---|---|---|
| Government and Nonprofit | 90% | 84% | 30% | 68% | 88% |
| Insurance | 90% | 75% | 24% | 10% | 91% |
| Travel, Hospitality, and Leisure | 86% | 85% | 30% | 55% | 84% |
| Education | 84% | 83% | 21% | 50% | 75% |
| Infrastructure and Utilities | 80% | 82% | 30% | 58% | 85% |
| Technology | 75% | 75% | 30% | 30% | 80% |
| Retail and Consumer | 73% | 80% | 30% | 40% | 82% |
| Healthcare and Life Sciences | 67% | 79% | 20% | 15% | 82% |
| B2B and Professional Services | 55% | 80% | 25% | 50% | 80% |
| Financial Services | 85% | 80% | 30% | 44% | 82% |
| Automotive | Not reported | 80% | 10% | 25% | 85% |
| Cite benchmarksSource: CMP Customer Contact Benchmarking dataset. Figures are 2026 industry medians. Automotive CES had too few responses to report a median. | |||||
| CES = Customer Effort Score | |||||
Healthcare and Life Sciences Call Center KPI Benchmarks
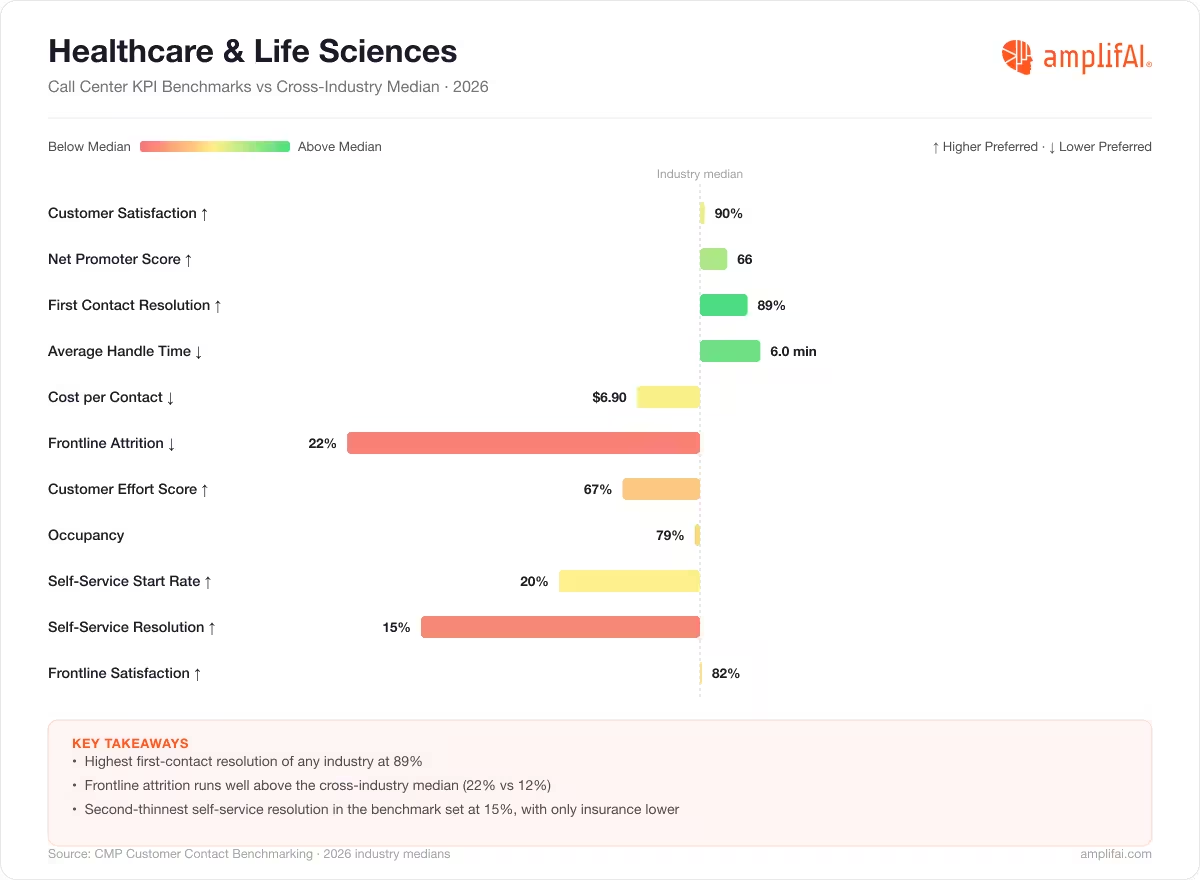
Healthcare and life sciences contact centers balance high-resolution expectations with patient effort, billing complexity, benefits questions, appointment demand, and frontline strain. Compare healthcare call center KPI benchmarks against the 2026 industry median, using the table to find where your contact center sits against similar support teams.
| Healthcare Call Center KPI Benchmark | What the Healthcare Benchmark Means | Healthcare Median |
|---|---|---|
| Customer Satisfaction | Healthcare has a 90% customer satisfaction median, with healthcare contact centers balancing patient expectations, care access questions, billing issues, benefits complexity, and service consistency across high-stakes interactions. | 90% |
| Net Promoter Score | Healthcare has a 66 NPS median, with patient and member loyalty shaped by access, trust, issue resolution, communication clarity, and the service experience surrounding care, coverage, billing, and benefits. | 66 |
| First Contact Resolution | Healthcare has the highest first contact resolution median at 89%, with healthcare contact centers resolving more patient access, billing, benefits, appointment, and care coordination questions during the first interaction than any other industry measured, a critical advantage where repeat contact adds patient effort and frontline workload. | 89% |
| Average Handle Time | Healthcare has a 6.0 minute average handle time median, with healthcare contact centers managing complex questions fast enough to stay near the cross-industry median while still handling patient access, billing, benefits, appointment, and care coordination work. | 6.0 min |
| Cost per Contact | Healthcare has a $6.90 cost per contact median, with patient access, billing, benefits, and care coordination work carrying service cost above the cross-industry median. | $6.90 |
| Frontline Attrition | Healthcare has a 22% frontline attrition median, with healthcare contact centers facing one of the highest turnover profiles measured as agents handle emotionally demanding questions, complex policies, billing friction, and patient access pressure. | 22% |
| Customer Effort Score | Healthcare has a 67% customer effort score median, with patient and member effort remaining elevated when billing questions, benefits details, appointment needs, referrals, authorizations, and care access issues require multiple steps to resolve. | 67% |
| Occupancy | Healthcare has a 79% occupancy median, with frontline workload leaving more capacity than most industries for follow-up, coaching, and recovery work. | 79% |
| Self-Service Start Rate | Healthcare has a 20% self-service start rate median, with fewer patient and member journeys beginning in self-service than most industries because healthcare questions often involve sensitive context, account detail, benefits rules, or appointment needs. | 20% |
| Self-Service Resolution Rate | Healthcare has a 15% self-service resolution rate median, with healthcare self-service resolving fewer journeys than most industries as patients and members move from digital channels to live support for billing, benefits, authorization, appointment, and access questions. | 15% |
| Frontline Satisfaction | Healthcare has an 82% frontline satisfaction median, with agent satisfaction holding near the middle of the benchmark range even as healthcare contact centers carry high attrition, complex interactions, and elevated patient effort. | 82% |
| Cite benchmarksSource: CMP Customer Contact Benchmarking dataset. Figures are 2026 healthcare and life sciences industry medians. | ||
Financial Services Call Center KPI Benchmarks
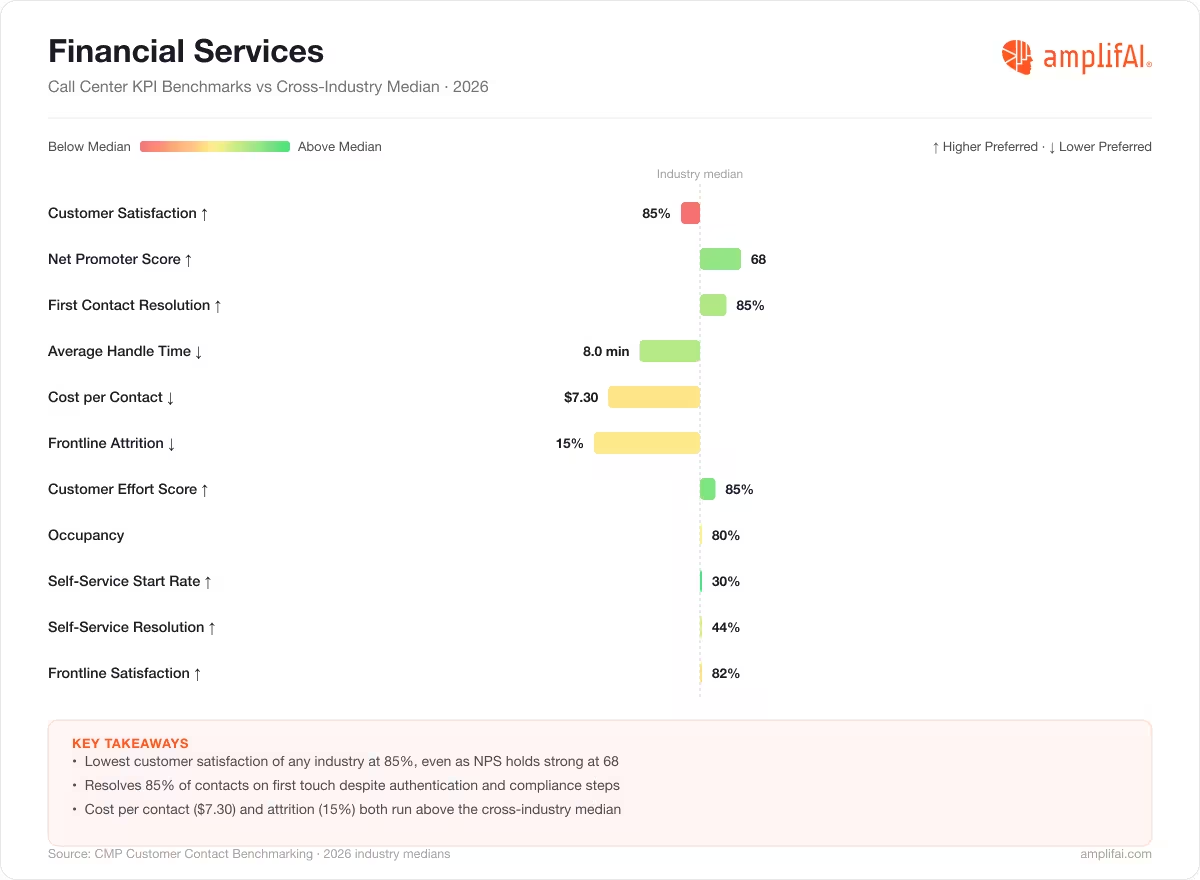
Financial services contact centers manage account access, fraud concerns, payment questions, loan servicing, card issues, authentication steps, and compliance-sensitive conversations. Compare financial services call center KPI benchmarks against the 2026 industry median, using the table to find where your contact center sits against similar support teams.
| Financial Services Call Center KPI Benchmark | What the Financial Services Benchmark Means | Financial Services Median |
|---|---|---|
| Customer Satisfaction | Financial services has the lowest customer satisfaction median at 85%, with account access, fraud concerns, payment issues, loan servicing, card disputes, and authentication steps adding friction to customer interactions. | 85% |
| Net Promoter Score | Financial services has a 68 NPS median, with customer loyalty supported by brand trust, product value, digital banking access, and long-term account relationships even as interaction satisfaction falls below any other industry measured. | 68 |
| First Contact Resolution | Financial services has an 85% first contact resolution median, with financial services contact centers resolving account, card, payment, fraud, loan, and servicing questions above the cross-industry median despite authentication, policy, and compliance requirements. | 85% |
| Average Handle Time | Financial services has an 8.0 minute average handle time median, with identity verification, account research, fraud review, payment context, and policy explanation extending conversations beyond the cross-industry median. | 8.0 min |
| Cost per Contact | Financial services has a $7.30 cost per contact median, with regulated service work, authentication, fraud handling, account research, and escalation paths increasing service cost compared with lower-complexity industries. | $7.30 |
| Frontline Attrition | Financial services has a 15% frontline attrition median, above the cross-industry median, with frontline teams handling compliance pressure, fraud risk, account stress, billing disputes, and emotionally charged money conversations. | 15% |
| Customer Effort Score | Financial services has an 85% customer effort score median, with digital banking access, account visibility, payment flows, and servicing paths reducing effort for routine account, card, and payment interactions. | 85% |
| Occupancy | Financial services has an 80% occupancy median, with steady demand across account servicing, payments, fraud, cards, loans, and digital banking support keeping frontline teams close to the cross-industry occupancy median. | 80% |
| Self-Service Start Rate | Financial services has a 30% self-service start rate median, with customers starting balance, payment, transaction, card, and account-servicing journeys through digital banking, IVR, mobile apps, and online account portals. | 30% |
| Self-Service Resolution Rate | Financial services has a 44% self-service resolution rate median, with digital banking and account portals resolving many routine tasks while fraud, disputes, loan questions, and complex servicing issues still move to live support. | 44% |
| Frontline Satisfaction | Financial services has an 82% frontline satisfaction median, with compliance pressure, authentication work, fraud risk, and dispute-heavy interactions keeping agent satisfaction near the middle of the benchmark range. | 82% |
| Cite benchmarksSource: CMP Customer Contact Benchmarking dataset. Figures are 2026 financial services industry medians. | ||
Insurance Call Center KPI Benchmarks
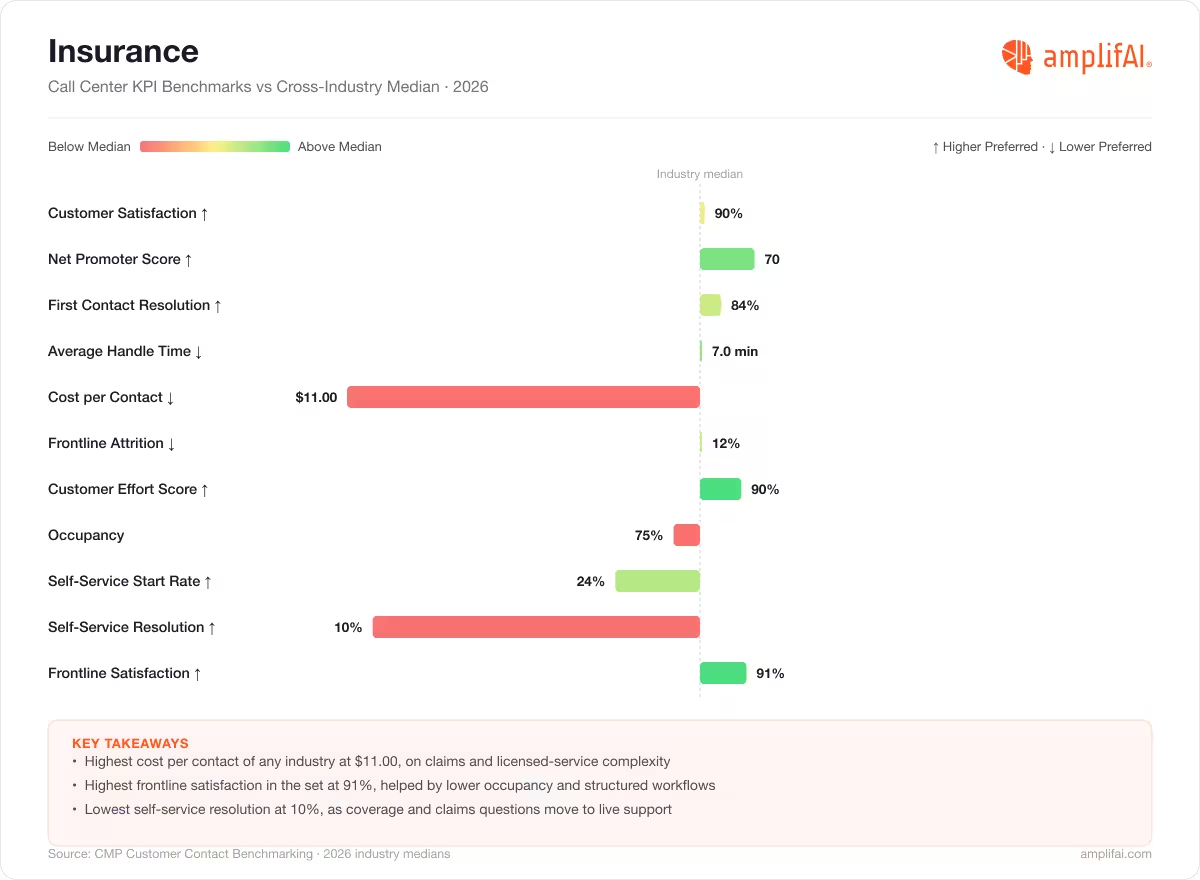
Insurance contact centers handle claims intake, policy servicing, coverage questions, billing, renewals, endorsements, adjuster coordination, and compliance-sensitive conversations. Compare insurance call center KPI benchmarks against the 2026 industry median, using the table to find where your contact center sits against similar support teams.
| Insurance Call Center KPI Benchmark | What the Insurance Benchmark Means | Insurance Median |
|---|---|---|
| Customer Satisfaction | Insurance has a 90% customer satisfaction median, with policyholders expecting clear answers on claims, coverage, premiums, billing, renewals, and policy changes during high-stakes service moments. | 90% |
| Net Promoter Score | Insurance has a 70 NPS median, with policyholder loyalty shaped by claims confidence, coverage clarity, renewal experience, agent support, and trust during moments where service quality carries financial impact. | 70 |
| First Contact Resolution | Insurance has an 84% first contact resolution median, with insurance contact centers resolving many claims, billing, coverage, policy, and renewal questions during the first interaction despite documentation, approval, and compliance requirements. | 84% |
| Average Handle Time | Insurance has a 7.0 minute average handle time median, with claims context, policy details, coverage explanations, billing history, and next-step guidance keeping conversations close to the cross-industry median. | 7.0 min |
| Cost per Contact | Insurance has the highest cost per contact median at $11.00, with claims handling, licensed-service requirements, policy complexity, documentation, compliance, and escalation paths raising service cost above any other industry measured. | $11.00 |
| Frontline Attrition | Insurance has a 12% frontline attrition median, with turnover landing near the cross-industry median as agents manage claims stress, policy complexity, billing disputes, and emotionally charged coverage conversations. | 12% |
| Customer Effort Score | Insurance has a 90% customer effort score median, with structured claims workflows, policy records, billing systems, and agent guidance helping policyholders move through complex service moments with less effort. | 90% |
| Occupancy | Insurance has a 75% occupancy median, with frontline workload leaving more capacity than most industries for documentation, claims follow-up, policy research, compliance review, and manager support. | 75% |
| Self-Service Start Rate | Insurance has a 24% self-service start rate median, with policyholders starting some billing, policy, claims-status, and document journeys online while complex coverage and claims questions still move quickly to live support. | 24% |
| Self-Service Resolution Rate | Insurance has a 10% self-service resolution rate median, the lowest reported rate in the benchmark set, with coverage questions, claims exceptions, billing nuance, and documentation needs limiting full digital resolution. | 10% |
| Frontline Satisfaction | Insurance has a 91% frontline satisfaction median, the highest reported rate in the benchmark set, with structured workflows, clearer policy records, and lower occupancy helping agents manage complex service work. | 91% |
| Cite benchmarksSource: CMP Customer Contact Benchmarking dataset. Figures are 2026 insurance industry medians. | ||
Retail and Consumer Call Center KPI Benchmarks
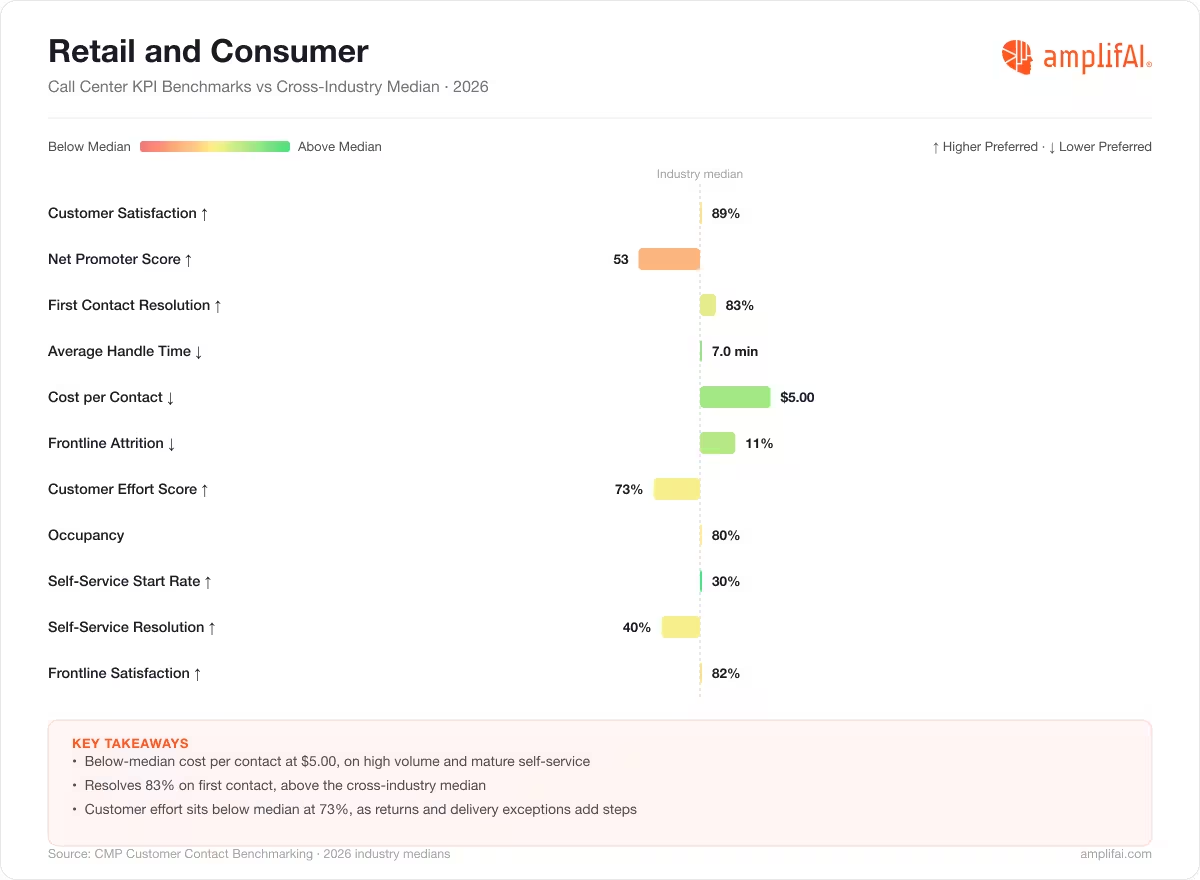
Retail and consumer contact centers handle order status, returns, refunds, delivery questions, inventory availability, promotions, loyalty accounts, ecommerce support, and store-service escalations. Compare retail and consumer call center KPI benchmarks against the 2026 industry median, using the table to find where your contact center sits against similar support teams.
| Retail and Consumer Call Center KPI Benchmark | What the Retail and Consumer Benchmark Means | Retail and Consumer Median |
|---|---|---|
| Customer Satisfaction | Retail and consumer has an 89% customer satisfaction median, with customers expecting fast answers on orders, returns, refunds, delivery timing, promotions, loyalty accounts, and product availability across high-volume service channels. | 89% |
| Net Promoter Score | Retail and consumer has a 53 NPS median, with loyalty shaped by product experience, price, fulfillment, delivery reliability, return friction, service recovery, and the consistency of ecommerce and store support. | 53 |
| First Contact Resolution | Retail and consumer has an 83% first contact resolution median, with retail contact centers resolving more order, refund, delivery, promotion, loyalty, and product questions during the first interaction than the cross-industry median. | 83% |
| Average Handle Time | Retail and consumer has a 7.0 minute average handle time median, with order lookup, refund status, delivery context, product questions, loyalty account details, and service recovery keeping conversations aligned with the cross-industry median. | 7.0 min |
| Cost per Contact | Retail and consumer has a $5.00 cost per contact median, with high interaction volume, repeatable service questions, ecommerce data, and self-service availability helping keep contact cost below the cross-industry median. | $5.00 |
| Frontline Attrition | Retail and consumer has an 11% frontline attrition median, with turnover staying slightly below the cross-industry median despite seasonal demand, high contact volume, refund pressure, delivery frustration, and promotion-driven spikes. | 11% |
| Customer Effort Score | Retail and consumer has a 73% customer effort score median, with customer effort rising when order issues, return rules, refund timing, delivery exceptions, and inventory gaps require multiple steps to resolve. | 73% |
| Occupancy | Retail and consumer has an 80% occupancy median, with steady ecommerce demand, post-purchase questions, seasonal volume, loyalty support, and service recovery keeping frontline teams close to the cross-industry workload median. | 80% |
| Self-Service Start Rate | Retail and consumer has a 30% self-service start rate median, with customers starting many order status, return, refund, delivery, loyalty, and product-support journeys through ecommerce sites, apps, IVR, and help centers. | 30% |
| Self-Service Resolution Rate | Retail and consumer has a 40% self-service resolution rate median, with self-service resolving many order status, return, delivery, and account questions while refund exceptions, damaged items, missing shipments, and service recovery still move to live support. | 40% |
| Frontline Satisfaction | Retail and consumer has an 82% frontline satisfaction median, with frontline satisfaction holding near the middle of the benchmark range as agents manage high-volume interactions, delivery frustration, refund pressure, and seasonal spikes. | 82% |
| Cite benchmarksSource: CMP Customer Contact Benchmarking dataset. Figures are 2026 retail and consumer industry medians. | ||
Technology Call Center KPI Benchmarks
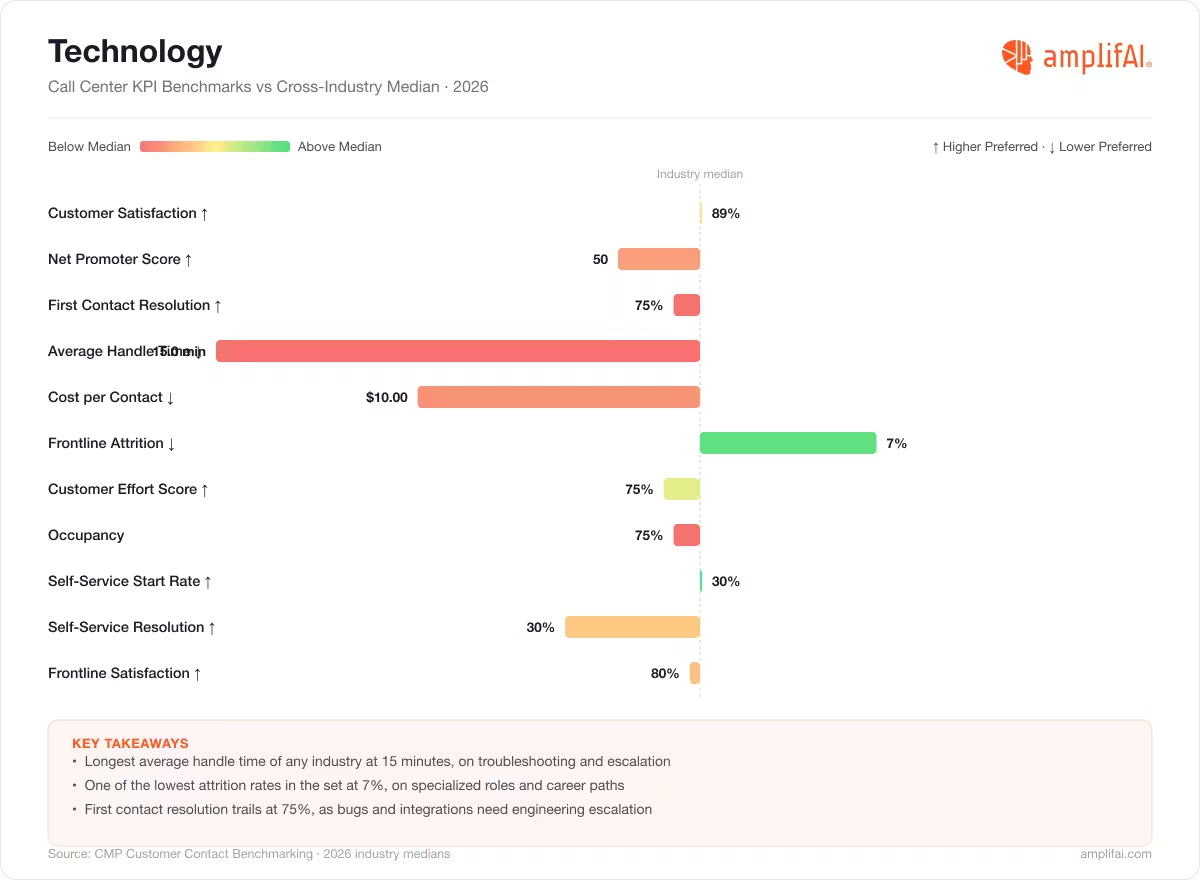
Technology contact centers handle product troubleshooting, SaaS account support, configuration questions, integration errors, outage updates, bug reports, subscription changes, device support, and escalation paths between frontline agents, product teams, and engineering. Compare technology call center KPI benchmarks against the 2026 industry median, using the table to find where your contact center sits against similar support teams.
| Technology Call Center KPI Benchmark | What the Technology Benchmark Means | Technology Median |
|---|---|---|
| Customer Satisfaction | Technology has an 89% customer satisfaction median, with customers expecting precise troubleshooting, account access, product guidance, integration support, outage communication, and escalation follow-through across complex technical interactions. | 89% |
| Net Promoter Score | Technology has a 50 NPS median, with loyalty shaped by product reliability, support accuracy, implementation success, uptime, renewal value, and the speed of resolving technical blockers. | 50 |
| First Contact Resolution | Technology has a 75% first contact resolution median, with complex troubleshooting, bug reproduction, configuration dependencies, integration errors, permission settings, and engineering escalations making first-interaction resolution harder than most industries. | 75% |
| Average Handle Time | Technology has the longest average handle time median at 15.0 minutes, with software troubleshooting, log review, configuration context, integration dependencies, bug investigation, and escalation coordination extending conversations above any other industry measured. | 15.0 min |
| Cost per Contact | Technology has the second-highest cost per contact median at $10.00, with specialized technical knowledge, support tiering, diagnostic work, bug investigation, and longer handle times increasing service cost. | $10.00 |
| Frontline Attrition | Technology has a 7% frontline attrition median, one of the lowest rates measured, with specialized support roles, product expertise, career paths, and lower volume volatility supporting stronger frontline retention. | 7% |
| Customer Effort Score | Technology has a 75% customer effort score median, with customers facing more effort when troubleshooting requires logs, configuration checks, account permissions, integration context, product expertise, or multiple support tiers. | 75% |
| Occupancy | Technology has a 75% occupancy median, with frontline workload leaving more capacity than most industries for diagnosis, research, documentation, escalation notes, and technical follow-up. | 75% |
| Self-Service Start Rate | Technology has a 30% self-service start rate median, with customers starting many account, product, troubleshooting, setup, billing, and knowledge-base journeys through help centers, product docs, community forums, apps, and support portals. | 30% |
| Self-Service Resolution Rate | Technology has a 30% self-service resolution rate median, with docs and portals resolving some setup, account, and known-error journeys while integration errors, bugs, outages, and configuration dependencies still move to live support. | 30% |
| Frontline Satisfaction | Technology has an 80% frontline satisfaction median, below many industries, with technical complexity, escalation pressure, product changes, documentation gaps, and customer urgency shaping frontline support work. | 80% |
| Cite benchmarksSource: CMP Customer Contact Benchmarking dataset. Figures are 2026 technology industry medians. | ||
Government and Nonprofit Call Center KPI Benchmarks
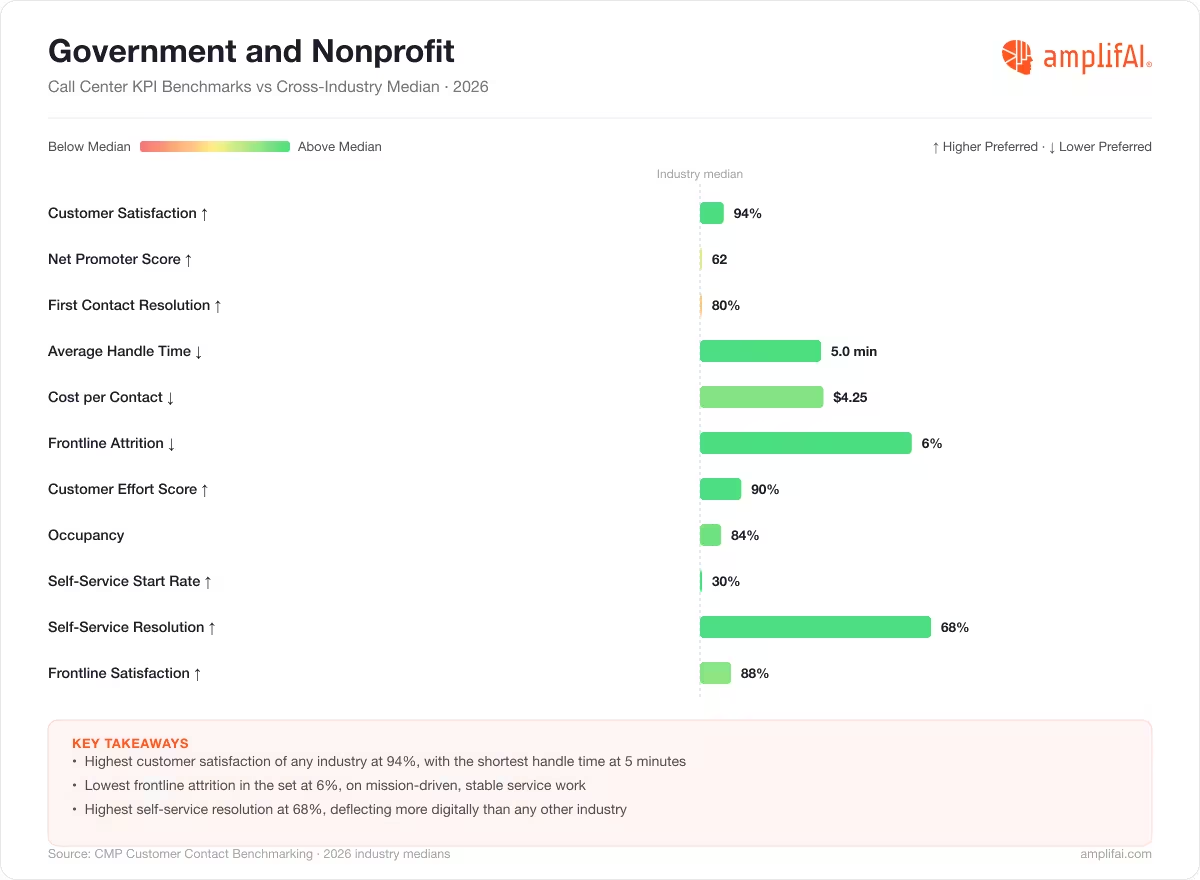
Government and nonprofit contact centers handle constituent services, public benefits, eligibility questions, permits, applications, case status, donations, grants, member support, volunteer questions, public records, and service access. Compare government and nonprofit call center KPI benchmarks against the 2026 industry median, using the table to find where your contact center sits against similar support teams.
| Government and Nonprofit Call Center KPI Benchmark | What the Government and Nonprofit Benchmark Means | Government and Nonprofit Median |
|---|---|---|
| Customer Satisfaction | Government and nonprofit contact centers have the highest customer satisfaction median at 94%, with constituents, members, donors, and program participants expecting clear answers on public services, benefits, applications, grants, donations, eligibility, and case status. | 94% |
| Net Promoter Score | Government and nonprofit contact centers have a 62 NPS median, with trust shaped by service access, transparency, response accuracy, program clarity, mission connection, and confidence that requests move through the right channel. | 62 |
| First Contact Resolution | Government and nonprofit contact centers have an 80% first contact resolution median, with public service, eligibility, application, donation, grant, member, and case-status questions resolving at the cross-industry median. | 80% |
| Average Handle Time | Government and nonprofit contact centers have the shortest average handle time median at 5.0 minutes, with standardized service questions, clear eligibility paths, repeatable application requests, and focused public information needs keeping conversations shorter than any other industry measured. | 5.0 min |
| Cost per Contact | Government and nonprofit contact centers have a $4.25 cost per contact median, with shorter handle times, repeatable service questions, public information workflows, and self-service resolution helping keep contact cost below the cross-industry median. | $4.25 |
| Frontline Attrition | Government and nonprofit contact centers have the lowest frontline attrition median at 6%, with mission-driven work, stable service demand, clearer program boundaries, and lower volume volatility supporting stronger frontline retention. | 6% |
| Customer Effort Score | Government and nonprofit contact centers have a 90% customer effort score median, with clear public information, eligibility guidance, application routing, case-status visibility, and service access reducing effort for constituents, members, donors, and program participants. | 90% |
| Occupancy | Government and nonprofit contact centers have an 84% occupancy median, with frontline teams carrying one of the highest workload profiles as public service demand, benefits questions, application support, and program inquiries keep agents consistently engaged. | 84% |
| Self-Service Start Rate | Government and nonprofit contact centers have a 30% self-service start rate median, with constituents, members, donors, and program participants starting many public information, application, donation, eligibility, and case-status journeys through websites, portals, IVR, and help centers. | 30% |
| Self-Service Resolution Rate | Government and nonprofit contact centers have the highest self-service resolution rate median at 68%, with public information, application status, donation records, eligibility guidance, and program details resolving digitally more often than any other industry measured. | 68% |
| Frontline Satisfaction | Government and nonprofit contact centers have an 88% frontline satisfaction median, with mission connection, lower attrition, clear program scope, and strong self-service resolution helping frontline teams manage public service and nonprofit support work. | 88% |
| Cite benchmarksSource: CMP Customer Contact Benchmarking dataset. Figures are 2026 government and nonprofit industry medians. | ||
Travel, Hospitality, and Leisure Call Center KPI Benchmarks
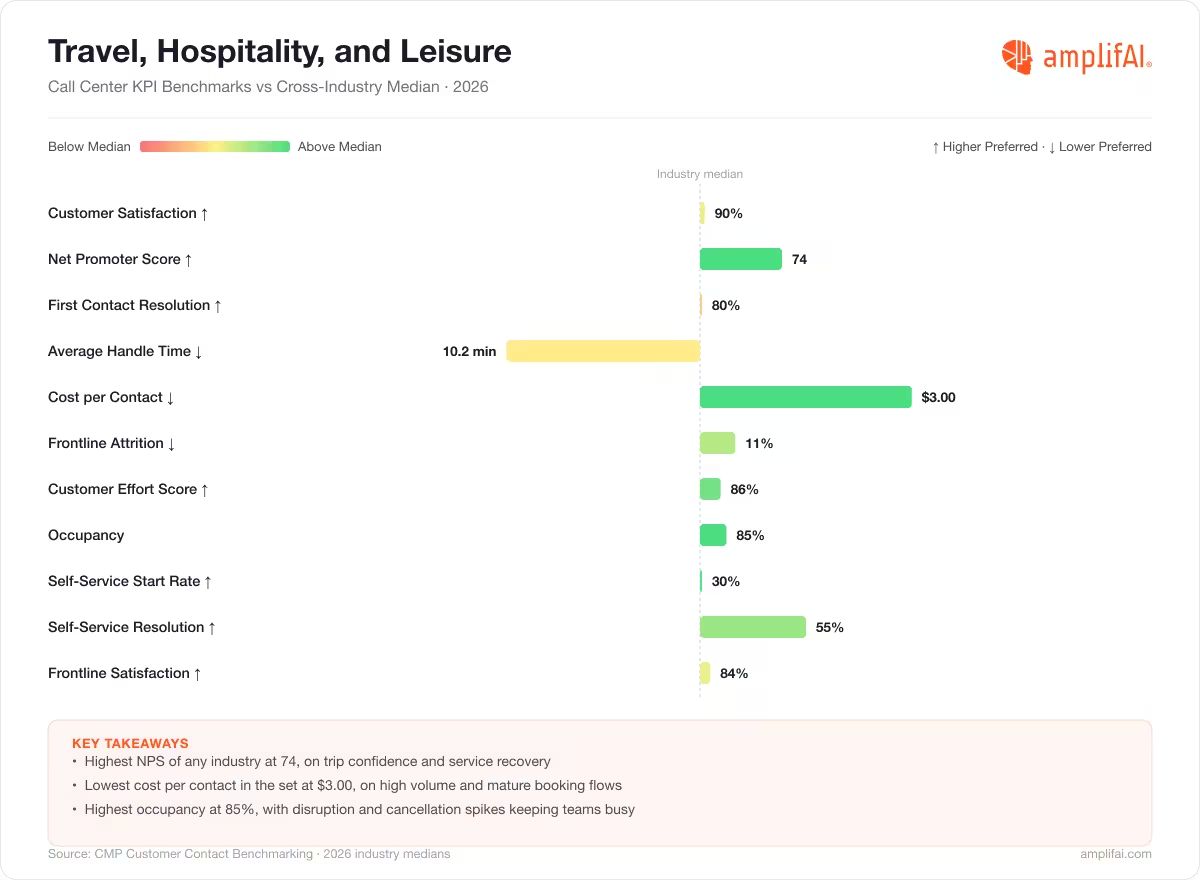
Travel, hospitality, and leisure contact centers handle reservations, itinerary changes, cancellations, refunds, loyalty accounts, guest services, check-in questions, baggage issues, property support, travel disruptions, and rebooking requests. Compare travel, hospitality, and leisure call center KPI benchmarks against the 2026 industry median, using the table to find where your contact center sits against similar support teams.
| Travel, Hospitality, and Leisure Call Center KPI Benchmark | What the Travel, Hospitality, and Leisure Benchmark Means | Travel, Hospitality, and Leisure Median |
|---|---|---|
| Customer Satisfaction | Travel, hospitality, and leisure has a 90% customer satisfaction median, with travelers and guests expecting fast answers on reservations, itinerary changes, cancellations, refunds, loyalty accounts, check-in, baggage, and disruption recovery. | 90% |
| Net Promoter Score | Travel, hospitality, and leisure has the highest NPS median at 74, with loyalty shaped by trip confidence, guest experience, service recovery, loyalty benefits, rebooking support, and how well brands handle disruption moments. | 74 |
| First Contact Resolution | Travel, hospitality, and leisure has an 80% first contact resolution median, with reservation, cancellation, refund, loyalty, baggage, property, and itinerary questions resolving at the cross-industry median despite time-sensitive service pressure. | 80% |
| Average Handle Time | Travel, hospitality, and leisure has the second-longest average handle time median at 10.2 minutes, with itinerary changes, disruption recovery, rebooking, refund rules, loyalty details, and property coordination extending conversations beyond most industries. | 10.2 min |
| Cost per Contact | Travel, hospitality, and leisure has the lowest cost per contact median at $3.00, with high-volume service demand, repeatable reservation questions, mature digital booking flows, and self-service resolution helping keep contact cost below any other industry measured. | $3.00 |
| Frontline Attrition | Travel, hospitality, and leisure has an 11% frontline attrition median, with turnover staying slightly below the cross-industry median despite seasonal demand, disruption spikes, refund pressure, and emotionally charged travel moments. | 11% |
| Customer Effort Score | Travel, hospitality, and leisure has an 86% customer effort score median, with booking visibility, loyalty access, reservation records, and mature self-service flows reducing effort across many routine travel and guest-service interactions. | 86% |
| Occupancy | Travel, hospitality, and leisure has the highest occupancy median at 85%, with frontline teams carrying sustained workload from reservation demand, disruption volume, cancellation spikes, loyalty support, and guest-service escalation. | 85% |
| Self-Service Start Rate | Travel, hospitality, and leisure has a 30% self-service start rate median, with travelers and guests starting many booking, itinerary, check-in, cancellation, refund, loyalty, and property-support journeys through apps, websites, IVR, and help centers. | 30% |
| Self-Service Resolution Rate | Travel, hospitality, and leisure has a 55% self-service resolution rate median, with digital booking, itinerary, check-in, loyalty, and cancellation workflows resolving more journeys than most industries while disruption recovery and refund exceptions still move to live support. | 55% |
| Frontline Satisfaction | Travel, hospitality, and leisure has an 84% frontline satisfaction median, with frontline satisfaction holding above the cross-industry middle even as agents manage high occupancy, time-sensitive disruption work, refund pressure, and seasonal demand. | 84% |
| Cite benchmarksSource: CMP Customer Contact Benchmarking dataset. Figures are 2026 travel, hospitality, and leisure industry medians. | ||
Infrastructure and Utilities Call Center KPI Benchmarks
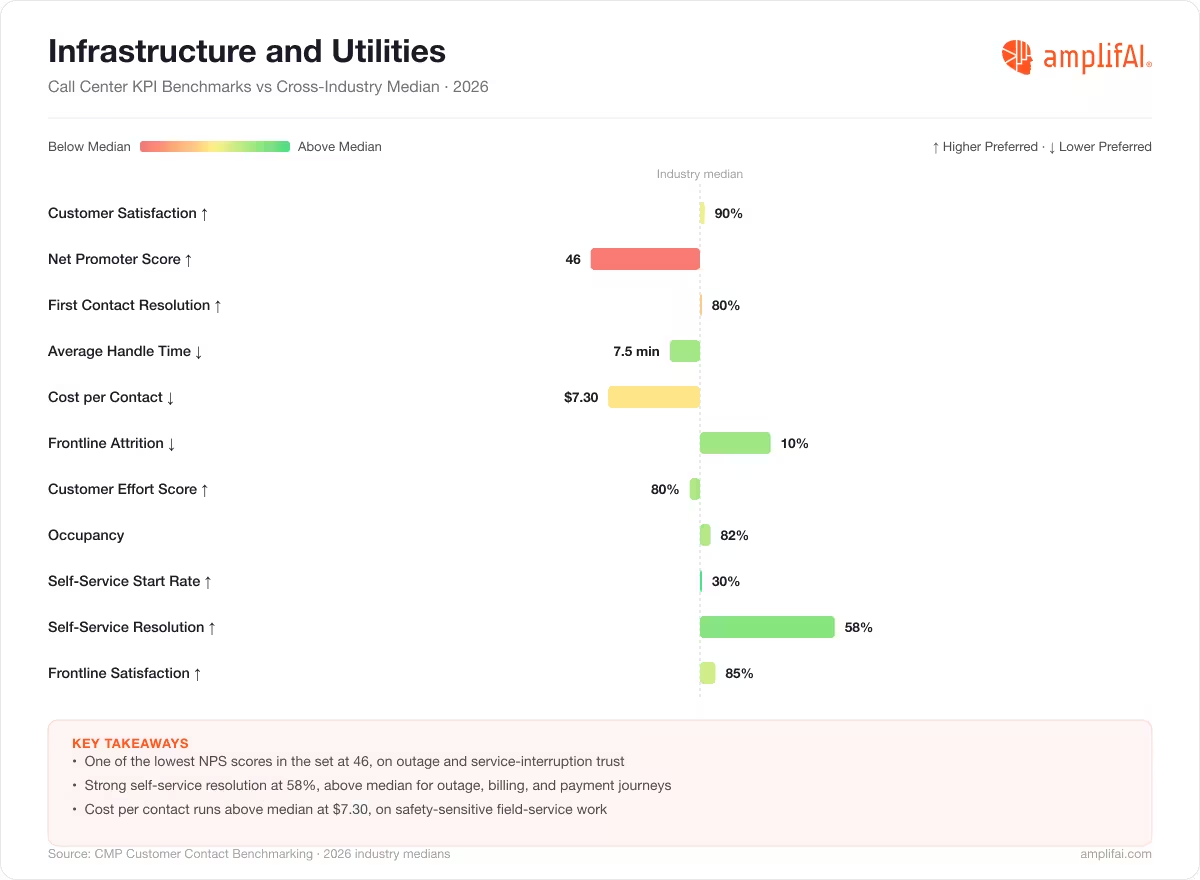
Infrastructure and utilities contact centers handle outage reporting, service restoration updates, billing questions, meter readings, rate changes, appointment scheduling, field service coordination, safety issues, service connections, and emergency support. Compare infrastructure and utilities call center KPI benchmarks against the 2026 industry median, using the table to find where your contact center sits against similar support teams.
| Infrastructure and Utilities Call Center KPI Benchmark | What the Infrastructure and Utilities Benchmark Means | Infrastructure and Utilities Median |
|---|---|---|
| Customer Satisfaction | Infrastructure and utilities has a 90% customer satisfaction median, with customers expecting reliable answers on outages, restoration timing, billing, meter readings, rates, appointments, service connections, safety issues, and field-service follow-up. | 90% |
| Net Promoter Score | Infrastructure and utilities has a 46 NPS median, with loyalty shaped by service reliability, outage communication, billing clarity, safety response, restoration confidence, and trust during service interruptions. | 46 |
| First Contact Resolution | Infrastructure and utilities has an 80% first contact resolution median, with outage, billing, rate, meter, appointment, service connection, and field-service questions resolving at the cross-industry median. | 80% |
| Average Handle Time | Infrastructure and utilities has a 7.5 minute average handle time median, with outage context, account history, billing explanation, service order details, safety triage, and field-service coordination extending conversations slightly above the cross-industry median. | 7.5 min |
| Cost per Contact | Infrastructure and utilities has a $7.30 cost per contact median, with safety-sensitive service work, outage support, field-service coordination, billing research, and service restoration updates raising contact cost above the cross-industry median. | $7.30 |
| Frontline Attrition | Infrastructure and utilities has a 10% frontline attrition median, with turnover staying below the cross-industry median as stable service demand, essential-service work, and clear process boundaries support frontline retention. | 10% |
| Customer Effort Score | Infrastructure and utilities has an 80% customer effort score median, with effort shaped by outage visibility, billing clarity, restoration updates, appointment coordination, service order status, and the number of steps needed to resolve account or safety issues. | 80% |
| Occupancy | Infrastructure and utilities has an 82% occupancy median, with frontline teams carrying sustained workload from outage calls, billing questions, meter issues, field-service appointments, rate questions, and service-connection requests. | 82% |
| Self-Service Start Rate | Infrastructure and utilities has a 30% self-service start rate median, with customers starting many outage, billing, payment, meter, appointment, rate, service-status, and service-connection journeys through apps, websites, IVR, and customer portals. | 30% |
| Self-Service Resolution Rate | Infrastructure and utilities has a 58% self-service resolution rate median, with outage status, payment, billing, appointment, and service updates resolving digitally more often than most industries while safety issues and complex service requests still move to live support. | 58% |
| Frontline Satisfaction | Infrastructure and utilities has an 85% frontline satisfaction median, with essential-service work, clear process boundaries, lower attrition, and mature self-service resolution helping agents manage outage, billing, safety, and field-service support. | 85% |
| Cite benchmarksSource: CMP Customer Contact Benchmarking dataset. Figures are 2026 infrastructure and utilities industry medians. | ||
Education Call Center KPI Benchmarks
| Education Call Center KPI Benchmark | What the Education Benchmark Means | Education Median |
|---|---|---|
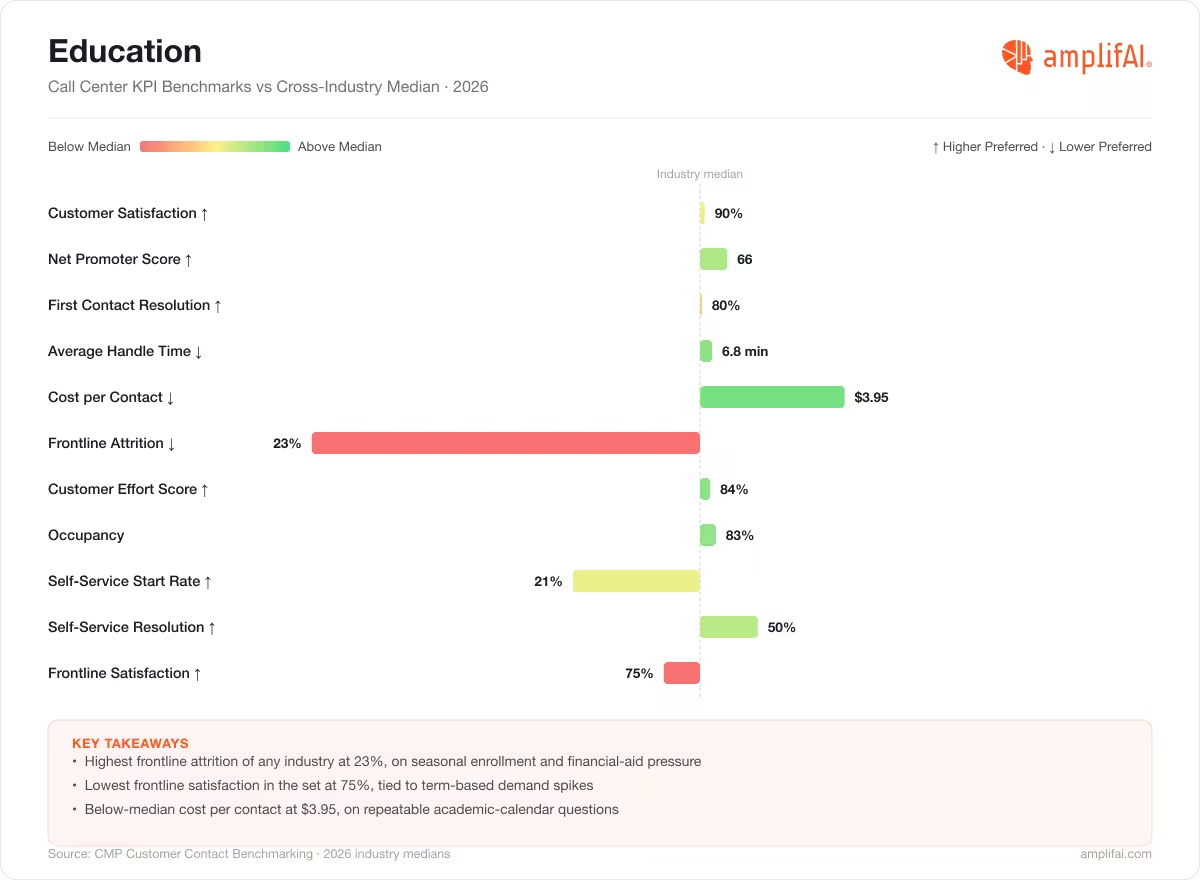
| Customer Satisfaction | Education has a 90% customer satisfaction median, with students, applicants, parents, and alumni expecting clear answers on admissions, enrollment, financial aid, registration, transcripts, student accounts, and campus services. | 90% |
| Net Promoter Score | Education has a 66 NPS median, with loyalty shaped by student experience, institutional trust, financial aid clarity, enrollment support, advising access, program value, and confidence that student needs move through the right channel. | 66 |
| First Contact Resolution | Education has an 80% first contact resolution median, with admissions, registration, financial aid, student account, transcript, advising, and course-access questions resolving at the cross-industry median. | 80% |
| Average Handle Time | Education has a 6.8 minute average handle time median, with student records, financial aid details, enrollment requirements, registration rules, transcript requests, and advising context keeping conversations close to the cross-industry median. | 6.8 min |
| Cost per Contact | Education has a $3.95 cost per contact median, with repeatable academic-calendar questions, student portal usage, enrollment workflows, and lower-cost service models keeping contact cost below the cross-industry median. | $3.95 |
| Frontline Attrition | Education has the highest frontline attrition median at 23%, with seasonal enrollment spikes, financial aid pressure, student account stress, campus service complexity, and term-based demand creating one of the hardest frontline retention profiles. | 23% |
| Customer Effort Score | Education has an 84% customer effort score median, with student portals, enrollment paths, financial aid workflows, registration tools, and transcript access reducing effort for many routine student-service interactions. | 84% |
| Occupancy | Education has an 83% occupancy median, with frontline teams carrying heavy workload during admissions cycles, registration windows, financial aid deadlines, semester starts, and term-based service peaks. | 83% |
| Self-Service Start Rate | Education has a 21% self-service start rate median, with fewer students, applicants, parents, and alumni starting service journeys in self-service than most industries despite portals for admissions, registration, transcripts, accounts, and financial aid. | 21% |
| Self-Service Resolution Rate | Education has a 50% self-service resolution rate median, with student portals resolving many registration, transcript, account, and information requests while financial aid, enrollment exceptions, advising, and campus-service questions still move to live support. | 50% |
| Frontline Satisfaction | Education has a 75% frontline satisfaction median, the lowest reported rate in the benchmark set, with seasonal demand, financial aid stress, enrollment pressure, student account complexity, and high attrition shaping frontline work. | 75% |
| Cite benchmarksSource: CMP Customer Contact Benchmarking dataset. Figures are 2026 education industry medians. | ||
B2B and Professional Services Call Center KPI Benchmarks
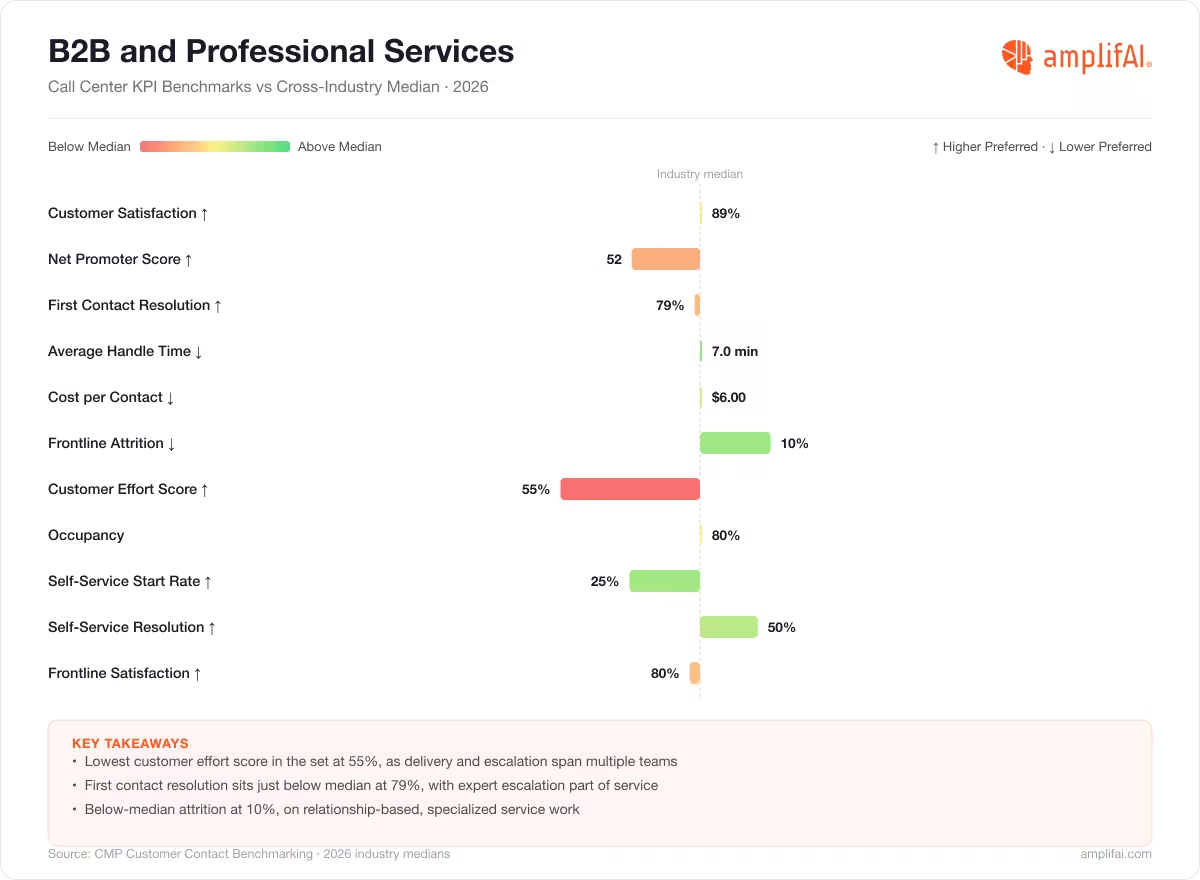
B2B and professional services contact centers handle client support, account management, onboarding questions, project status, billing, contract details, implementation support, service delivery, renewal questions, and expert escalation. Compare B2B and professional services call center KPI benchmarks against the 2026 industry median, using the table to find where your contact center sits against similar support teams.
| B2B and Professional Services Call Center KPI Benchmark | What the B2B and Professional Services Benchmark Means | B2B and Professional Services Median |
|---|---|---|
| Customer Satisfaction | B2B and professional services has an 89% customer satisfaction median, with clients expecting accurate answers on account status, onboarding, billing, contracts, project timelines, service delivery, renewal needs, and escalation paths. | 89% |
| Net Promoter Score | B2B and professional services has a 52 NPS median, with loyalty shaped by relationship quality, delivery confidence, account ownership, project outcomes, billing clarity, renewal value, and trust in the expertise behind the service. | 52 |
| First Contact Resolution | B2B and professional services has a 79% first contact resolution median, with account, onboarding, billing, contract, project, renewal, and implementation questions resolving slightly below the cross-industry median as expert escalation remains part of service delivery. | 79% |
| Average Handle Time | B2B and professional services has a 7.0 minute average handle time median, with client context, project details, contract terms, billing records, implementation history, and service-delivery questions keeping conversations aligned with the cross-industry median. | 7.0 min |
| Cost per Contact | B2B and professional services has a $6.00 cost per contact median, with specialized knowledge, account context, expert escalation, project coordination, and contract detail keeping service cost near the cross-industry median. | $6.00 |
| Frontline Attrition | B2B and professional services has a 10% frontline attrition median, with relationship-based service work, specialized knowledge, more stable demand, and lower volume volatility supporting stronger retention than the cross-industry median. | 10% |
| Customer Effort Score | B2B and professional services has a 55% customer effort score median, the lowest reported rate in the benchmark set, with client effort rising when service delivery, account ownership, billing, contracts, project status, and expert escalation span multiple teams. | 55% |
| Occupancy | B2B and professional services has an 80% occupancy median, with frontline teams handling steady client demand across onboarding, billing, account support, renewal questions, project status, implementation support, and service delivery. | 80% |
| Self-Service Start Rate | B2B and professional services has a 25% self-service start rate median, with clients starting some billing, account, onboarding, project, renewal, and documentation journeys through portals, knowledge bases, help centers, and client-service systems. | 25% |
| Self-Service Resolution Rate | B2B and professional services has a 50% self-service resolution rate median, with portals and knowledge bases resolving many account, documentation, project-status, and billing questions while implementation issues, contract nuance, and expert escalation still move to live support. | 50% |
| Frontline Satisfaction | B2B and professional services has an 80% frontline satisfaction median, with specialized knowledge, account context, project complexity, expert escalation, and low customer effort performance shaping frontline service work. | 80% |
| Cite benchmarksSource: CMP Customer Contact Benchmarking dataset. Figures are 2026 B2B and professional services industry medians. | ||
Automotive Call Center KPI Benchmarks
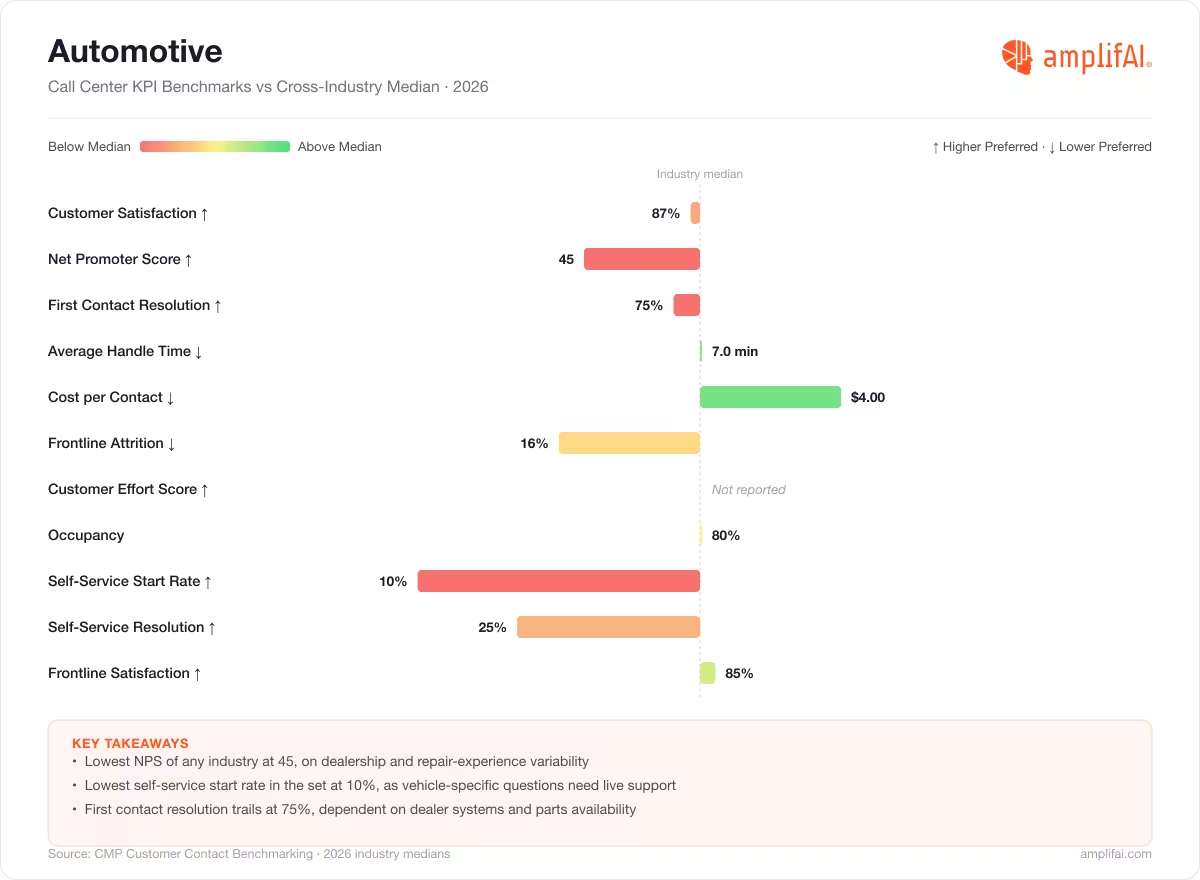
Automotive contact centers handle service scheduling, warranty questions, recall support, roadside assistance, financing, lease questions, repair status, parts availability, dealership coordination, connected vehicle support, and ownership support. Compare automotive call center KPI benchmarks against the 2026 industry median, using the table to find where your contact center sits against similar support teams.
| Automotive Call Center KPI Benchmark | What the Automotive Benchmark Means | Automotive Median |
|---|---|---|
| Customer Satisfaction | Automotive has an 87% customer satisfaction median, with owners expecting clear answers on service appointments, repairs, warranty coverage, recalls, roadside assistance, financing, lease terms, parts availability, and dealership follow-up. | 87% |
| Net Promoter Score | Automotive has a 45 NPS median, with loyalty shaped by vehicle reliability, dealership experience, service quality, warranty confidence, repair communication, financing support, and ownership support after purchase. | 45 |
| First Contact Resolution | Automotive has a 75% first contact resolution median, with service, warranty, recall, repair, financing, lease, roadside, and dealership questions resolving below the cross-industry median as many issues depend on dealer systems, parts availability, or service-center follow-up. | 75% |
| Average Handle Time | Automotive has a 7.0 minute average handle time median, with vehicle details, service history, warranty rules, repair status, recall lookup, financing context, and dealership coordination keeping conversations aligned with the cross-industry median. | 7.0 min |
| Cost per Contact | Automotive has a $4.00 cost per contact median, with repeatable service questions, dealership routing, warranty lookup, recall information, and ownership support keeping contact cost below the cross-industry median. | $4.00 |
| Frontline Attrition | Automotive has a 16% frontline attrition median, with turnover running above the cross-industry median as agents manage repair frustration, dealership coordination, warranty disputes, recall concern, roadside urgency, and financing questions. | 16% |
| Customer Effort Score | Automotive CES had too few responses to report a median, with CSAT, first contact resolution, self-service resolution, and frontline satisfaction carrying the customer-experience benchmark for automotive contact centers. | Not reported |
| Occupancy | Automotive has an 80% occupancy median, with frontline teams handling steady demand across service scheduling, repair status, warranty questions, recall support, financing, lease support, roadside assistance, and dealership coordination. | 80% |
| Self-Service Start Rate | Automotive has a 10% self-service start rate median, the lowest rate measured, with owners starting fewer journeys in self-service when service scheduling, repair status, warranty, recall, financing, and dealership questions require account or vehicle-specific support. | 10% |
| Self-Service Resolution Rate | Automotive has a 25% self-service resolution rate median, with recall lookup, service scheduling, account information, and basic ownership questions resolving digitally while warranty disputes, repair status, parts availability, financing, and dealership coordination still move to live support. | 25% |
| Frontline Satisfaction | Automotive has an 85% frontline satisfaction median, with frontline satisfaction holding above the benchmark middle as agents manage steady workload, vehicle-specific questions, dealership coordination, warranty complexity, and repair-related customer frustration. | 85% |
| Cite benchmarksSource: CMP Customer Contact Benchmarking dataset. Figures are 2026 automotive industry medians. Automotive CES had too few responses to report a median. | ||
How to Read Call Center KPI Benchmarks
Call center KPI benchmarks should be read in KPI groups, not as isolated targets.
CSAT, NPS, and customer effort score measure separate parts of the customer experience, while first contact resolution, average handle time, and cost per contact measure how well your contact center resolves issues, handles complexity, limits repeat contact, and controls service costs.
Self-service start rate and self-service resolution rate belong together, as customers might begin their journey in self-service without resolving their issue there. Attrition, occupancy, and frontline satisfaction also belong together, as customer experience may appear healthy while frontline teams absorb high workload, seasonal demand, complex interactions, and weak coaching follow-up.
Industry context changes how a benchmark should be interpreted, a 10 minute average handle time carries a different meaning in technology, travel, healthcare, and government, or a lower self-service resolution rate points to issue complexity, regulated workflows, account-specific support needs, or digital service gaps.
Call Center KPI Benchmark Methodology
AmplifAI’s call center KPI benchmarks use median values from CMP Research’s Customer Contact Benchmarking dataset, with 2026 data spanning 11 industries and benchmark categories including customer experience, resolution, handle time, service cost, self-service, occupancy, attrition, and frontline satisfaction.
Industry medians used in this guide mark the midpoint for benchmarks, placing half of benchmarked contact centers above the median and half below the median, while sample sizes vary by industry and metric, with Automotive CES excluded from median reporting due to limited responses.
Metric definitions differ across contact centers, a benchmark comparison only holds when both sides measure a KPI the same way. Frontline attrition, self-service resolution, customer effort score, and cost per contact shift with survey method, channel mix, reporting period, workforce model, and whether the count includes internal, outsourced, or blended teams.
How AmplifAI Improves Call Center KPI Benchmarks
AmplifAI ingests contact center data across CCaaS, CRM, QA, WFM, surveys, transcripts, interaction records, and internal business sources, connecting KPI movement to the call reasons, quality findings, repeat-contact drivers, customer effort patterns, and coaching history behind each performance gap.
With complete unified call center data turned into next best role-specific actions, AmplifAI gives leaders the agent, behavior, evidence, priority, and closed-loop workflows needed to improve FCR, CSAT, AHT, cost per contact, attrition, self-service outcomes, and frontline satisfaction.
Powered by patented AI, AmplifAI provides QA automation, quality and compliance, coaching, recognition, and customer analytics through unified role-based performance dashboards, giving agents, team leaders, QA teams, CX leaders, and executives the performance KPIs that matter and the next best actions to move them.
Get a closer look at where your call center KPI benchmarks stand and how to improve them, speak to a CX leader at AmplifAI.
Speak to a CX Leader at AmplifAI
Call Center KPI Benchmark FAQs
How to use call center KPI benchmarks?
Contact center leaders should read call center KPI benchmarks as industry comparison points, using related metrics to explain inconsistencies. First contact resolution scores below the industry standard point to repeat contact, but comparing them to average handle time, cost per contact, CSAT, and customer effort shows whether the issue is service complexity, inefficient resolution, customer friction, or all three.
How to improve call center KPI benchmarks?
Improve call center KPI benchmarks by connecting reporting, coaching, QA, and performance workflows into one system that shows where performance moves and which action closes the gap next. Compare the top call center analytics software or review the best call center performance management software for improving KPI visibility, follow-up, and performance outcomes.
What is a good call center KPI benchmark?
A good call center KPI benchmark is the industry median that matches your service model, channel mix, and customer complexity. A seven-minute average handle time can be healthy in complex healthcare support and weak in simple retail order-status support, contact center leaders need to read each benchmark against issue type, first contact resolution, cost per contact, and customer effort. AmplifAI's call center KPI benchmarks master table gives you a practical median average for the most common KPIs across industries, including CSAT, NPS, first contact resolution, average handle time, cost per contact, and frontline attrition.